Fuel consumption curve: two simple ways
Marfle solution collects automatically and continuously location and speed data from the vessel motion. On top of that, vast amount of engine CAN bus data is collected, the most important features (among others) being Fuel Rate, RPM, oil pressure and boost pressure. Marfle solution cleanses the data items and displays them on the Vessel Screen.
One could argue that the most elementary output is Fuel Consumption Curve. There are two simple ways to use that curve.
- Accurate Sea Trial Results
Vessel manufacturers as well as many vessel owners and operators do sea trials that are telling us about the performance and the condition of the vessel. The routines for sea trials have existed for a long time.
However, with Marfle solution the monitoring and accuracy may be taken to the next level: it is possible to verify the correct execution of the sea trial plan and high-resolution data is accessible in all stages of the trial and can be replayed in the modern Marfle user-interface at any time. As no data is ever lost, various further data analysis tools may be employed.
- Finding local optimals in RPM curve.
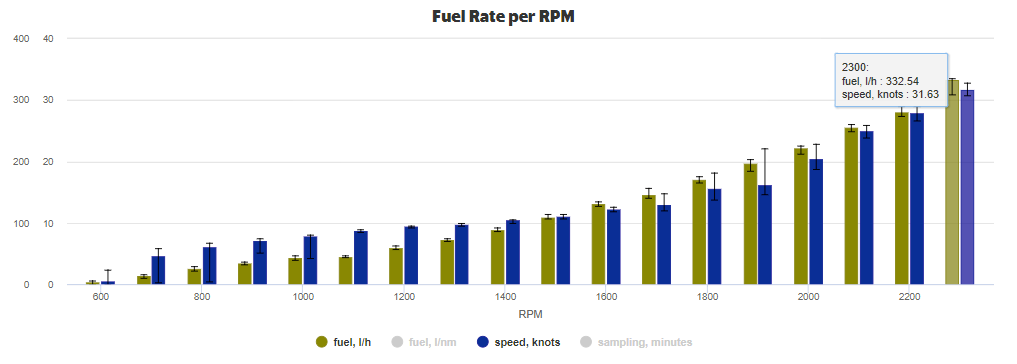
Vessels are usually designed to operate on specific speed and RPM ranges. The fact can be seen easily from the fuel consumption curve (below), where idle and the optimal speed has the most operating hours (green bar). Helmsmen are professional what comes in driving your vessels but their styles may vary. Also, the helmsmen's feeling about the vessel and the measured data may not exactly be the same. With accurate measurements fleet manager may guide helmsmen to optimal use and share the best-practises among helmsmen.
Marfle solution brings very detailed data for the fleet manager in order to adjust the RPM range to be best suited for the job and to prolong the engine life-cycle. Savings in fuel consumption is one natural target. Below you find a case study done by Marfle.
This boat drives pretty well on its optimal RPM ranges, but when there is a speed limit area, the drivers are speeding unduly RPM range on 1200 (See green bar at 1200 RPM). When studying ranges from 1100 to 1300 rpm, the speed increase is almost non-existent while the fuel consumption is increasing sharply (see blue bar and red bar). The local optimal for driving speed limit areas is therefore 1100 RPM.
Guiding the helmsmen to use 1100 RPM when operating around this speed, it can be estimated that 150 litres of fuel could have been saved on this trip. In other words, fleet manager gains almost 1.5% total saving in fuel consumption with one single calculation and one single change. This and other similar phenomena may be found from Fuel Consumption Curve.
Marfle team is continuously investigating vessel data to find things to automate and opportunities to save. Fuel Consumption Curve is just one example of the power of Marfle solution and analytics.
For any further inquiries, please contact
Ville Kajatsalo / Co-Founder
Marfle Fleet Analytics