Marfle Motion Analytics
Photo by Mik Henriksen
Marfle Analytics is a SaaS for vessel owners to track and analyse operations and efficiency of the vessels. It's a realtime online analytics service for marine fleet. You can browse into your vessels dashboard and timeline any time anywhere. Dashboard is for
- Managers
- Vessel Master & Crew
- Your customers
- Your engine / maintenance supplier
And you can use it on any device anywhere you have internet connection.
Since the first version of Marfle Fleet Analytics on 2016 we focused on engine data and the use cases we can provide with all that:
- Fuel economy analysis and control
- Minimising wearing with driving style alerts
- Engine problem diagnosis
- Prognosis / Predictive maintenance
- Operations review and reporting
Last year (2019) we did our first motion sensor installations to CTV's and Pilot Boats - a totally new dataset for Marfle. At the moment we have motion sensors on 9 vessels. We have used a lot of R&D to implement VMMS metrics in Marfle Analytics Service.
Metrics we have implemented this far are
- Docking impact force
- Calculation of heave amplitude
- Motion sickness
Of course you can review the 6DF raw motion data from every trip too.
Turbine visits analysis
For CTV's we have implemented wind turbine visit analysis, example below.
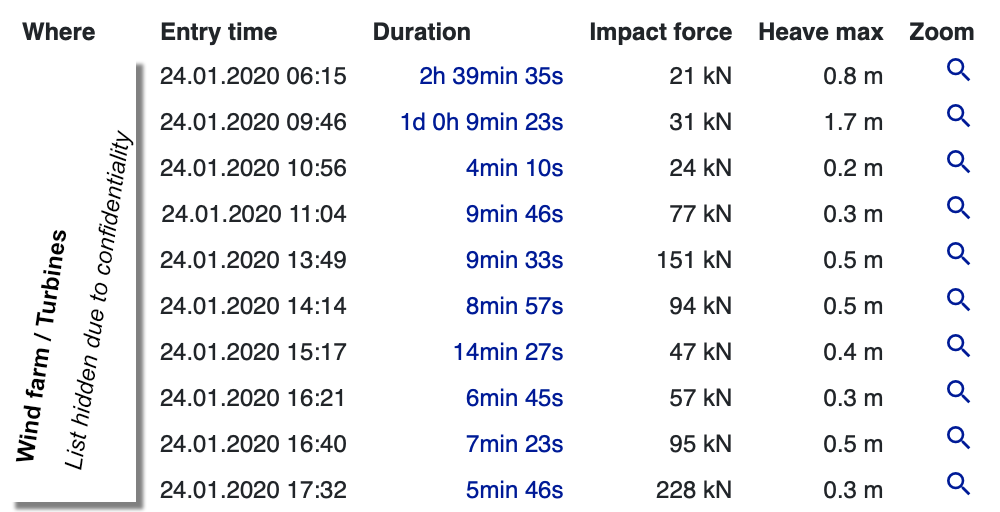
It shows
- Turbine name
- Time and duration
- Force measured while docking to turbine
- Maximum momentary heave aplitude
- Link to zoom into data
Docking impact
Below you can see a graph we have zoomed in to a single turbine visit.
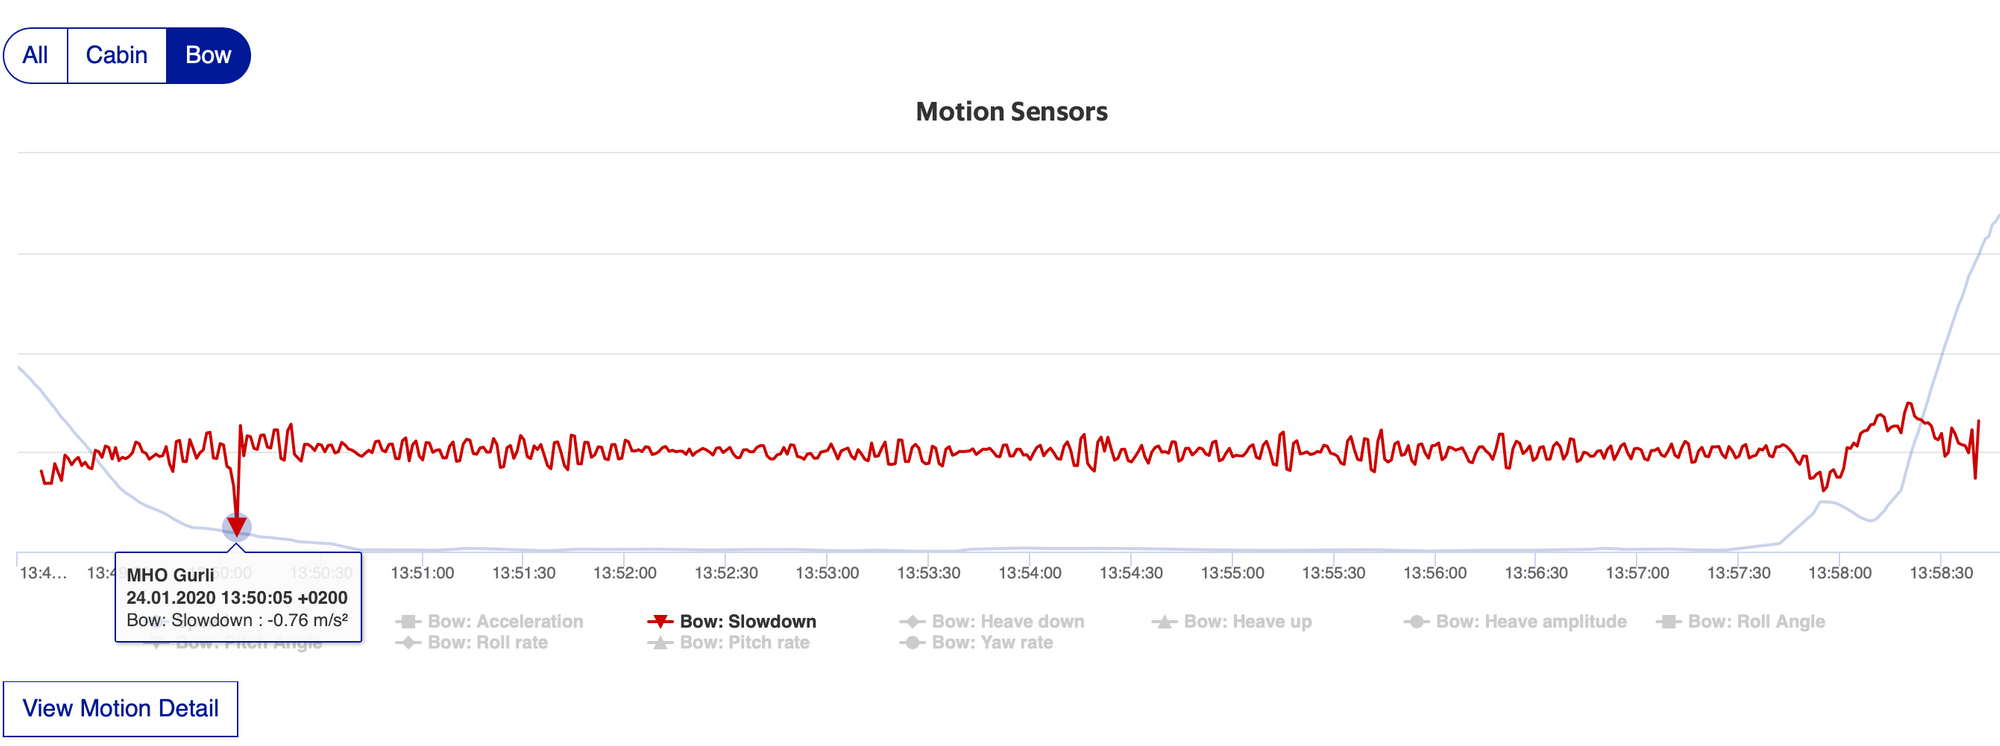
Docking impact is measured from accelerations on forward-backward axis of the motion sensor installed on bow of the CTV.
You can see the docking impact as a dip in beginning of the turbine visit review graph.
This metrics is important because high forces accelerate wearing of turbine tower and wind turbine and may lead to higher life-cycle costs of the turbine.
Heave amplitude
Below is the same turbine visit as in previous example. I just changed the metrics to heave amplitude.
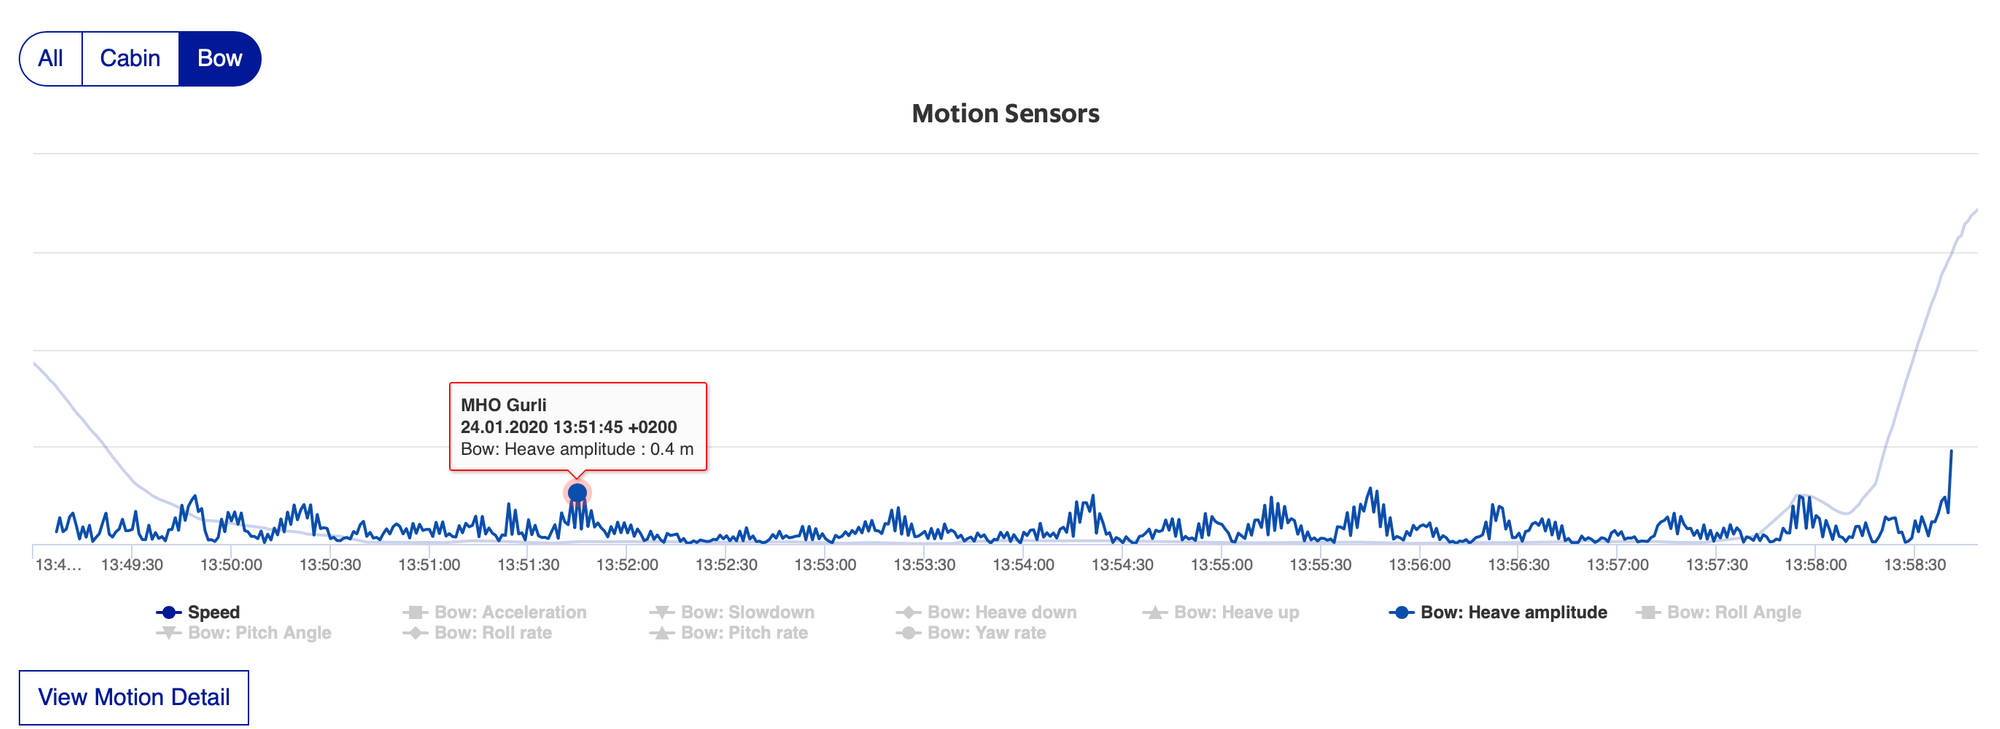
Low values mean it's secure for technicians to disembark to turbine.
Motion sickness exposure rate
Our third metrics is motion sickness. It's implemented according to ISO 2631-1 standard.
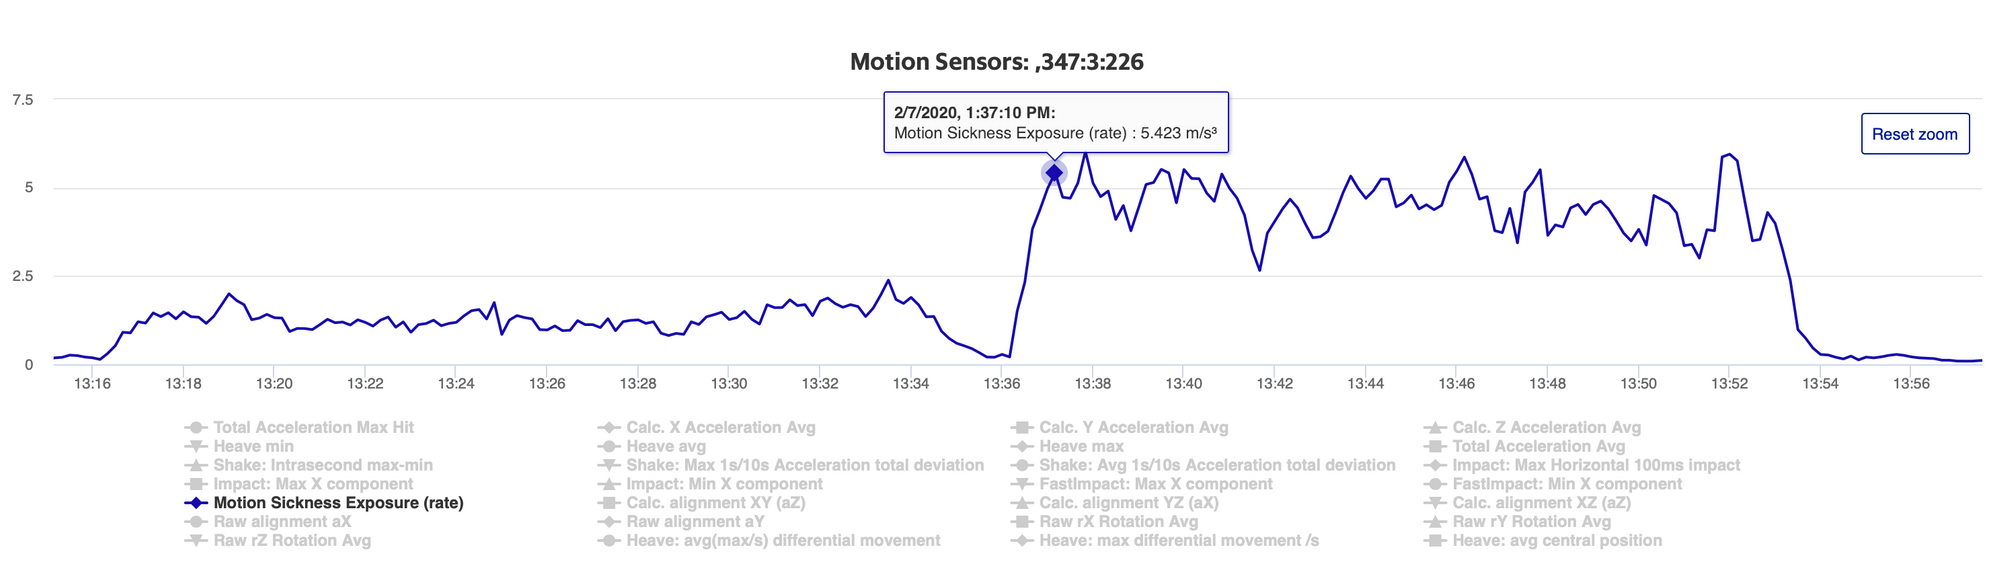
Motion sickness is not only related of the amount of heave acceleration but also the frequencies found on heave curve. We analyse the motion sickness exposure rate from heave signal on 100 Hz rate. From motion sickness exposure we calculate motion sickness dose value (%) for transits / trips.